Showing posts with label PT. Show all posts

Saturday, 9 May 2026

How to Troubleshoot Long running SQL In Oracle 19C Database Step by step Lab

 Hi All,


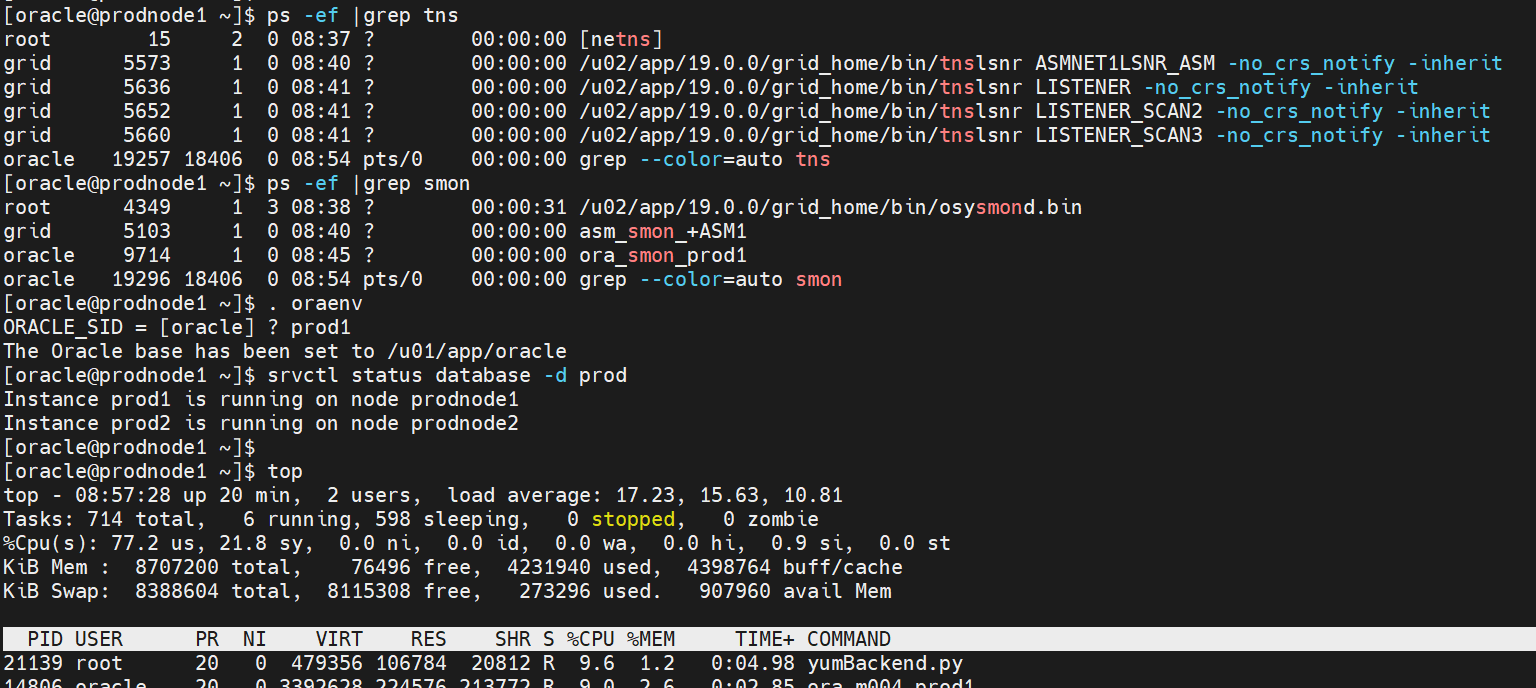
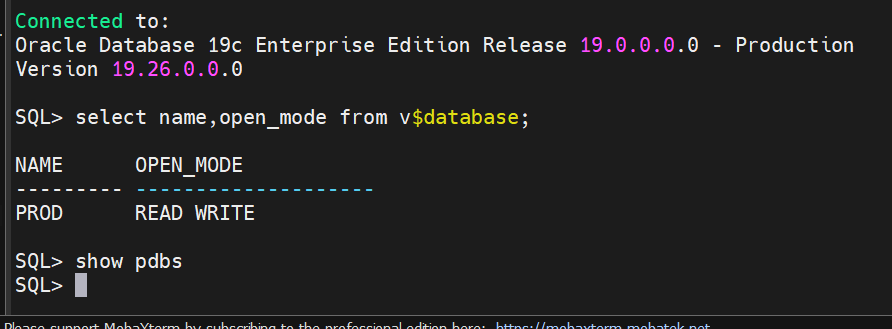
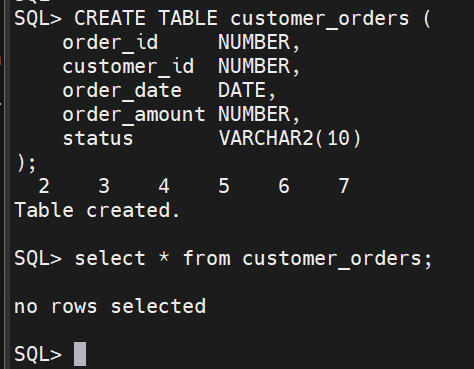
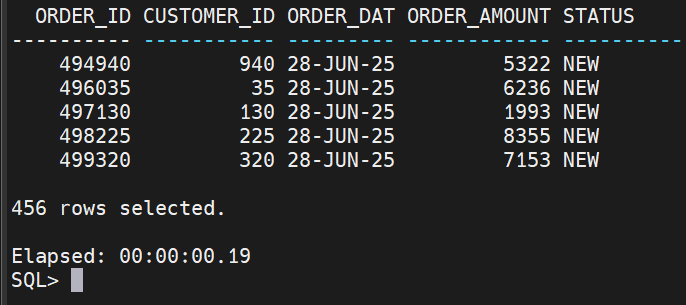
In this post i will show how to Troubleshoot Long running SQL In Oracle 19C Database Step by step Lab, with explanation.

Most of the times we will receive complains from application team,saying that ,  as till yesterday query execution was  right and all of suddenly they started observing lag in execution or and some cases not even giving any result. 


as a DBA when we check from our end, mostly we will see plan change and that is due many reasons. 


Below are few checks DBA can try to find why sql plan got changed. 


Though the Oracle Optimizer, you can just give hint if its a small query and you understand the execution flow as well as you know the data. 

But for many large queries its not possible to fix with hint, you have to live with Oracle Optimizer to decide the SQL plan. 

You can also forcefully map any plan to particular SQL ID, but that option need to consider carefully.

Why Plan got changed? or Why SQL is slow check few option mentioned below.

Course if action as DBA we should check below 11 steps one by one, all steps are not mandatory but as per the issue troubleshoot, we have to check until the issue cause and fix identified.


Check for any stale statistics.

col TABLE_NAME for a30

col PARTITION_NAME for a20

col SUBPARTITION_NAME for a20

select OWNER,TABLE_NAME,PARTITION_NAME,SUBPARTITION_NAME,NUM_ROWS,LAST_ANALYZED from dba_TAB_STATISTICS where STALE_STATS='YES';


Next 

Check any invalid index/Partition : 

col TABLE_NAME for a30

oracle@ggnode1>  select owner,index_name,TABLE_NAME,NUM_ROWS,LAST_ANALYZED,STATUS from dba_indexes where status not in ('VALID','N/A');


oracle@ggnode1>  select INDEX_OWNER,INDEX_NAME,PARTITION_NAME,SUBPARTITION_COUNT,LAST_ANALYZED,STATUS from dba_ind_partitions where status <> 'USABLE';


Check free memory shared pool area. Check too much hard parsing.


oracle@ggnode1> select * from (select SQL_ID,PARSING_SCHEMA_NAME, count(1) from v$sql group by SQL_ID,PARSING_SCHEMA_NAME order by  3 desc,2) where rownum<=10;


Wait/ Blocking analysis.

 Display blocked session and their blocking session details.

SELECT sid, serial#, blocking_session_status, blocking_session FROM   v$session WHERE  blocking_session IS NOT NULL;


Display the resource or event the session is waiting for more than 1 minutes

SELECT sid, serial#, event, (seconds_in_wait/1000000) seconds_in_wait FROM   v$session where (seconds_in_wait/1000000) > 60 ORDER BY sid;


select sid,seq#,event,state,SECONDS_IN_WAIT from v$session_wait where SECONDS_IN_WAIT > 60;


Monitor Top Waiting Event Using Active Session History (ASH)

SELECT h.event, SUM(h.wait_time + h.time_waited) "Total Wait Time (ms)" FROM v$active_session_history h, v$sqlarea SQL, dba_users u, v$event_name e WHERE h.sample_time BETWEEN sysdate - 1/24 AND sysdate --event in the last hour AND h.sql_id = SQL.sql_id AND h.user_id = u.user_id AND h.event# = e.event# GROUP BY h.event ORDER BY SUM(h.wait_time + h.time_waited) DESC;


Tablespace Usage

Monitor Overall Oracle Tablespace

SELECT d.STATUS "Status",

d.tablespace_name "Name",

d.contents "Type",

d.extent_management "Extent Management",

d.initial_extent "Initial Extent",

TO_CHAR(NVL(a.bytes / 1024 / 1024, 0),'99,999,990.900') "Size (M)",

TO_CHAR(NVL(a.bytes - NVL(f.bytes, 0), 0)/1024/1024,'99,999,999.999') "Used (M)",

TO_CHAR(NVL((a.bytes - NVL(f.bytes, 0)) / a.bytes * 100, 0), '990.00') "Used %",

TO_CHAR(NVL(a.maxbytes / 1024 / 1024, 0),'99,999,990.900') "MaxSize (M)",

TO_CHAR(NVL((a.bytes - NVL(f.bytes, 0)) / a.maxbytes * 100, 0), '990.00') "Used % of Max"

FROM sys.dba_tablespaces d,

(SELECT tablespace_name,

SUM(bytes) bytes,

SUM(decode(autoextensible,'NO',bytes,'YES',maxbytes))

maxbytes FROM dba_data_files GROUP BY tablespace_name) a,

(SELECT tablespace_name, SUM(bytes) bytes FROM dba_free_space

GROUP BY tablespace_name) f

WHERE d.tablespace_name = a.tablespace_name(+)

AND d.tablespace_name = f.tablespace_name(+)

ORDER BY 10 DESC;


Check for Memory parameters usage

Estimation Of Shared Memory Pool Size vs. Time Saved 

SELECT shared_pool_size_for_estimate "Pool Size (MB)",

estd_lc_size "Lib Cache Size (MB)",

estd_lc_time_saved/1000000 "Lib Cache Time Saved (Sec)"

FROM v$shared_pool_advice;


Estimation Of Buffer Cache Size vs. Physical Reads

SELECT size_for_estimate "Cache Size (MB)",

buffers_for_estimate "Buffers",

estd_physical_read_factor "Estd Phys|Read Factor",

estd_physical_reads "Estd Phys| Reads"

FROM v$db_cache_advice

WHERE name = 'DEFAULT'

AND block_size = (SELECT VALUE FROM V$PARAMETER WHERE name = 'db_block_size')

AND advice_status = 'ON';


SGA Advisor ::: 

select sga_size,sga_size_factor,estd_db_time from v$sga_target_advice;


PGA Advisor :::: 

select pga_target_for_estimate,pga_target_factor,estd_extra_bytes_rw from v$pga_target_advice;


 SQL Tuning using :::: 

SQL> @?/rdbms/admin/sqltrpt


 AWR various Report.

SQL> @?/rdbms/admin/awrsqrpt.sql --> awr report for only single sql_id

SQL> @?/rdbms/admin/awrrpt.sql   --> Traditional awr report for instance.


SQL> @?/rdbms/admin/awrgrpt.sql -- AWR Global Report (RAC) (global report)

SQL> @?/rdbms/admin/awrgdrpt.sql -- AWR Global Diff Report (RAC)

Other important scripts under $ORACLE_HOME/rdbms/admin

SQL> @?/rdbms/admin/spawrrac.sql -- Server Performance RAC report

SQL> @?/rdbms/admin/awrsqrpt.sql -- Standard SQL statement Report

SQL> @?/rdbms/admin/awrddrpt.sql -- Period diff on current instance

SQL> @?/rdbms/admin/awrrpti.sql -- Workload Repository Report Instance (RAC)


Note :::  To more analysis why plan has changed one can check support.oracle.com.


Thanks,

Srini

Friday, 8 May 2026

How to find the top 10 sql's and Find How much PGA usage in Oracle 19C DB

 Dear All,


In this post i am sharing few useful SQL's and How to find the top 10 sql's and Find How much PGA usage in Oracle 19C DB.


1) To find corrupt Object/Segments using file_id and block_id


select segment_name,block_id,file_id from dba_extents where FILE_ID=&1 and &2 between block_id and block_id+blocks-1

/


 Indexes created on Table_name


set lin 10000

col INDEX_NAME for a30

col TABLE_NAME for a30

col index_type for a25

col status for a10

--col LAST_ANALYZED for a19 wrap

col column_name for a20

col column_expression for a25

select a.INDEX_NAME ,b.column_name, column_expression,a.TABLE_NAME,STATUS,INDEX_TYPE

from user_indexes a,user_ind_columns b, user_ind_expressions c

where a.table_name = upper(trim('&1'))

and a.TABLE_NAME=b.TABLE_NAME

and a.INDEX_NAME=b.INDEX_NAME

and a.INDEX_NAME=c.INDEX_NAME (+)

and a.INDEX_NAME=c.INDEX_NAME (+)


Current running query


set lin 10000

col sid for 999999999

col serial# for  9999999999

col osuer for a20

col SQL_TEXT for a70 wrap

col osuser for a10

col status for a10

--select sid,serial#, status, osuser,b.EXECUTIONS,b.DISK_READS, b.SQL_TEXT from v$session a,  v$sqlarea b

--where a.SQL_ADDRESS=b.ADDRESS

--and b.HASH_VALUE = a.SQL_HASH_VALUE

select sid,serial#, status, osuser,b.EXECUTIONS,b.DISK_READS, b.SQL_TEXT from v$session a,  v$sql b

where a.SQL_ADDRESS=b.ADDRESS

and b.HASH_VALUE = a.SQL_HASH_VALUE

order by 6 desc,5 desc

/


To find query how much memory (PGA)


SET LINESIZE 145

SET PAGESIZE 9999

COLUMN sid FORMAT 999  HEADING 'SID'

COLUMN oracle_username  FORMAT a12     HEADING 'Oracle User'     JUSTIFY right

COLUMN os_username FORMAT a9  HEADING 'O/S User' JUSTIFY right

COLUMN session_program  FORMAT a18     HEADING 'Session Program' TRUNC

COLUMN session_machine  FORMAT a18      HEADING 'Machine'  JUSTIFY right TRUNC

COLUMN session_pga_memory      FORMAT 9,999,999,999  HEADING 'PGA Memory'

COLUMN session_pga_memory_max  FORMAT 9,999,999,999  HEADING 'PGA Memory Max'

COLUMN session_uga_memory      FORMAT 9,999,999,999  HEADING 'UGA Memory'

COLUMN session_uga_memory_max  FORMAT 9,999,999,999  HEADING 'UGA Memory MAX'

SELECT

    s.sid  sid

  , lpad(s.username,12)  oracle_username

  , lpad(s.osuser,9)     os_username

  , s.program     session_program

  , lpad(s.machine,8)    session_machine

  , (select ss.value from v$sesstat ss, v$statname sn

     where ss.sid = s.sid and

    sn.statistic# = ss.statistic# and

    sn.name = 'session pga memory') session_pga_memory

  , (select ss.value from v$sesstat ss, v$statname sn

     where ss.sid = s.sid and

    sn.statistic# = ss.statistic# and

    sn.name = 'session pga memory max')    session_pga_memory_max

  , (select ss.value from v$sesstat ss, v$statname sn

     where ss.sid = s.sid and

    sn.statistic# = ss.statistic# and

    sn.name = 'session uga memory') session_uga_memory

  , (select ss.value from v$sesstat ss, v$statname sn

     where ss.sid = s.sid and

    sn.statistic# = ss.statistic# and

    sn.name = 'session uga memory max')    session_uga_memory_max

FROM

    v$session  s

ORDER BY session_pga_memory DESC

/


 SID  Oracle User  O/S User Session Program               Machine     PGA Memory PGA Memory Max     UGA Memory UGA Memory MAX

---- ------------ --------- ------------------ ------------------ -------------- -------------- -------------- --------------

  20                 oracle oracle@ggnode1 (M0  ggnode1               32,850,736     59,786,032     23,623,584     29,389,984

  18                 oracle oracle@ggnode1 (MM  ggnode1               23,875,304     26,562,280      4,287,472     21,663,552

 252                 oracle oracle@ggnode1 (TT  ggnode1               20,333,360     20,333,360        367,072        367,072

 274                 oracle oracle@ggnode1 (J0  ggnode1               11,682,608    104,809,264        367,072        367,072

 246                 oracle oracle@ggnode1 (DB  ggnode1                8,953,728     10,478,112        367,072        367,072

  42                 oracle oracle@ggnode1 (M0  ggnode1                5,718,832              0         65,488        628,864

 262                 oracle oracle@ggnode1 (M0  ggnode1                5,522,224      8,274,736      3,650,952      5,102,328

  41          SYS    oracle sqlplus@ggnode1 (T  ggnode1                5,006,336     19,489,792      1,611,368      2,893,104

   9                 oracle oracle@ggnode1 (DI  ggnode1                4,844,408      4,844,408        367,072        367,072

  27                 oracle oracle@ggnode1 (CJ  ggnode1                4,411,112      7,294,696      2,462,592      5,014,824

  28                 oracle oracle@ggnode1 (W0  ggnode1                3,556,144      4,408,112      2,070,120      2,633,496

   7                 oracle oracle@ggnode1 (DB  ggnode1                3,533,688      4,123,512      1,742,320      1,873,296

 275                 oracle oracle@ggnode1 (W0  ggnode1                3,425,072      4,408,112      1,929,584      3,006,712

 251                 oracle oracle@ggnode1 (LR  ggnode1                3,354,136      3,681,816        970,864      1,152,952

 250                 oracle oracle@ggnode1 (RE  ggnode1                2,764,312      3,026,456        970,856      1,280,040

  12                 oracle oracle@ggnode1 (SM  ggnode1                2,698,776      3,419,672        970,864      1,458,232

   6          SYS    oracle oracle@ggnode1 (OF  ggnode1                2,567,704      2,567,704        825,488        890,976

  38                 oracle oracle@ggnode1 (Q0  ggnode1                2,442,032      2,900,784      1,036,344      1,341,656

  10                 oracle oracle@ggnode1 (LG  ggnode1                2,379,496      2,379,496        367,072        367,072

  11                 oracle oracle@ggnode1 (CK  ggnode1                2,282,496      2,282,496        367,072        367,072

   4                 oracle oracle@ggnode1 (W0  ggnode1                2,245,424      2,573,104        839,888      1,210,680

   3                 oracle oracle@ggnode1 (GE  ggnode1                2,174,488      2,174,488        367,072        367,072

 263                 oracle oracle@ggnode1 (Q0  ggnode1                2,114,352      2,114,352        498,048        498,048

 259                 oracle oracle@ggnode1 (W0  ggnode1                2,114,352      6,964,016        498,048        498,048

 256                 oracle oracle@ggnode1 (AQ  ggnode1                2,043,416      2,043,416        367,072        367,072

  13                 oracle oracle@ggnode1 (W0  ggnode1                2,031,760      7,291,696        629,048      1,283,976

  15                 oracle oracle@ggnode1 (W0  ggnode1                1,917,744      2,442,032        498,056      1,152,952

   8                 oracle oracle@ggnode1 (SV  ggnode1                1,912,344      1,912,344        367,072        367,072

 253                 oracle oracle@ggnode1 (MM  ggnode1                1,912,344      1,912,344        367,072        432,560

 245                 oracle oracle@ggnode1 (PM  ggnode1                1,846,808      1,846,808        367,072        367,072

 244                 oracle oracle@ggnode1 (VK  ggnode1                1,846,808      1,846,808        367,072        367,072

 242                 oracle oracle@ggnode1 (DI  ggnode1                1,846,808      1,846,808        367,072        367,072

 241                 oracle oracle@ggnode1 (GE  ggnode1                1,846,808      1,846,808        367,072        367,072

 240                 oracle oracle@ggnode1 (MM  ggnode1                1,846,808      1,846,808        367,072        367,072

  19                 oracle oracle@ggnode1 (TM  ggnode1                1,846,808      1,846,808        367,072        367,072

  17                 oracle oracle@ggnode1 (PX  ggnode1                1,846,808      1,846,808        367,072        367,072

 239                 oracle oracle@ggnode1 (VK  ggnode1                1,846,808      1,846,808        367,072        367,072

   2                 oracle oracle@ggnode1 (PS  ggnode1                1,846,808      1,846,808        367,072        367,072

 249                 oracle oracle@ggnode1 (SM  ggnode1                1,846,808      1,846,808        367,072        367,072

 238                 oracle oracle@ggnode1 (CL  ggnode1                1,797,728      1,797,728        367,072        367,072

   1                 oracle oracle@ggnode1 (PM  ggnode1                1,797,728      1,797,728        367,072        367,072

 255                 oracle oracle@ggnode1 (Q0  ggnode1                1,786,672      1,786,672        432,560        432,560

  24                 oracle oracle@ggnode1 (TT  ggnode1                1,655,600      1,655,600        367,072        367,072

  22                 oracle oracle@ggnode1 (QM  ggnode1                1,655,600      1,655,600        367,072        367,072

   5                 oracle oracle@ggnode1 (SC  ggnode1                1,655,600      1,655,600        367,072        367,072

 269                 oracle oracle@ggnode1 (W0  ggnode1                1,655,600      1,655,600        367,072        367,072

 248                 oracle oracle@ggnode1 (LG  ggnode1                1,655,600      1,655,600        367,072        367,072

 247                 oracle oracle@ggnode1 (LG  ggnode1                1,655,600      1,655,600        367,072        367,072

 237                 oracle oracle@ggnode1 (TT  ggnode1                1,655,600      1,655,600        367,072        367,072

 243                 oracle oracle@ggnode1 (SC  ggnode1                1,655,600      1,655,600        367,072        367,072

  35                 oracle oracle@ggnode1 (W0  ggnode1                1,655,600      1,655,600        367,072        367,072


51 rows selected.


Find  Active SQL old versions ::: 

SELECT nvl(ses.username,'ORACLE PROC')||' ('||ses.sid||')' USERNAME,

    SID,  

    MACHINE,

    REPLACE(SQL.SQL_TEXT,CHR(10),'') STMT,

    ltrim(to_char(floor(SES.LAST_CALL_ET/3600), '09')) || ':'

    || ltrim(to_char(floor(mod(SES.LAST_CALL_ET, 3600)/60), '09')) || ':'

    || ltrim(to_char(mod(SES.LAST_CALL_ET, 60), '09'))    RUNT

FROM    V$SESSION SES,  

    V$SQLtext_with_newlines SQL

where SES.STATUS = 'ACTIVE'

    and SES.USERNAME is not null

    and SES.SQL_ADDRESS    = SQL.ADDRESS

    and SES.SQL_HASH_VALUE = SQL.HASH_VALUE

    and Ses.AUDSID <> userenv('SESSIONID')

order by runt desc, 1,sql.piece;


Thanks,

Srini

Friday, 27 June 2025

SQL Troubleshooting Step By Step Lab in Oracle 19c RAC Database

 Hi All,


In this post i am sharing related to SQL Troubleshooting lab excise Step by step Process.

Firstly check the status of database services and load on the servers.


- here i am using 2 Node RAC Database , as we can see from the above snap 2 nodes database are running fine, will bit load on this server.

- Check the database status and confirmed its not a multitenant database 


- For SQL Troubleshooting Lab we can create a Table and load some data 

SQL> CREATE TABLE customer_orders (

    order_id     NUMBER,

    customer_id  NUMBER,

    order_date   DATE,

    order_amount NUMBER,

    status       VARCHAR2(10)

);

Table created.

SQL> select * from customer_orders;

no rows selected


- No data in that table , now i can load some data 

SQL> BEGIN

  FOR i IN 1 .. 500000 LOOP

  INSERT INTO customer_orders VALUES (

      i,

      MOD(i, 1000),

      SYSDATE - MOD(i, 365),

      ROUND(DBMS_RANDOM.VALUE(100, 10000)),

      CASE WHEN MOD(i, 3) = 0 THEN 'NEW'

           WHEN MOD(i, 3) = 1 THEN 'CLOSED'

           ELSE 'PENDING' END

    );

  END LOOP;

  COMMIT;

END;

 /


PL/SQL procedure successfully completed.

SQL> select count(*) from customer_orders;

  COUNT(*)

----------

    500000


- Now i have loaded 5 lakh rows of data.

- From this table we try to access the data and we can identify how much resource it consume like CPU memory and whether its taking full table scan or how we can see it.

-  this sql is insufficient.

SELECT * FROM customer_orders WHERE TO_CHAR(order_date, 'YYYY-MM-DD') = '2025-06-28' AND status = 'NEW';


- Here we can see more rows of data  , problems from this query is TO_CHAR() disables index usage , Causes Full table scan , also it leads to High CPU and I/O usage.

Now here is main point how we can troubleshoot this problematic sql .

- Generate explain Plan for this sql .

EXPLAIN PLAN FOR SELECT * FROM customer_orders WHERE TO_CHAR(order_date, 'YYYY-MM-DD') = '2025-06-28' AND status = 'NEW';


- here can see this sql is full table scan


- we can generate AWR and monitor this sql .

@$ORACLE_HOME/rdbms/admin/awrrpt.sql 

we can check the TOP sql   by Elapsed time / Buffer Gets also look for db file scattered read( sign of Full Table scan).

- Monitor the active sql's which are executing this sql will work from 19C db onwards.


SQL> SELECT sql_id, sql_text, status, elapsed_time, cpu_time

FROM v$sql_monitor WHERE status = 'EXECUTING';

 no rows selected


How to Troubleshoot the above Full table scan ? 

- From the above sql we identified problems which are

Issue 1 :  TO_CHAR() disables index usage , Causes Full table scan 

Fix for Issue 1 : 

SQL> SELECT * FROM customer_orders WHERE order_date = TO_DATE('2025-06-28', 'YYYY-MM-DD') AND status = 'NEW';

no rows selected

- Add index to that table .

SQL> CREATE INDEX idx_order_date_status ON customer_orders(order_date, status);

Index created.


- re-run the explain plan and see the output .

EXPLAIN PLAN FOR SELECT * FROM customer_orders WHERE order_date = TO_DATE('2025-06-28', 'YYYY-MM-DD') AND status = 'NEW';

Explained.


- Now its Index  range scan we avoid the full table scan . 

SQL Monitor report: should show reduced elapsed time
AWR: reduced cost/CPU/IO stats

Post Index creation You should see faster execution and lower logical reads .


SELECT * FROM customer_orders WHERE TO_CHAR(order_date, 'YYYY-MM-DD') = '2025-06-28' AND status = 'NEW';


without Index :


after index : 


Note: Generally we dont see when we used where clause with small amount of data request but in real time when we are accessing huge amount of data then we can understand clearly the power of Indexing .


Thanks ,
Srini


Monday, 23 January 2017

purging a cursor when Stuck in execution plans


I was at a UKOUG RAC/HA special interest group meeting last month. My favorite presentation of the day {out of what was a very good selection} was by Harald Van Breederode, an Oracle University DBA trainer from the Netherlands.  Harald’s presentation was on Checkpoints, a feature of Oracle that most DBAs tend to know a little about but never look into extensively. If you are a member of the UKOUG you can get the slides {If you are not a member, and you are in the UK {{or even Europe}}, nag your boss, get a membership – the conferences and meetings are a great source of info}.
Anyway, that is not the topic of this Blog. I finally downloaded a copy of the slides today and I checked out Harald’s blog. I immediately learnt something, which isthe topic of this blog.
In Oracle 10.2.0.4 (and upwards I assume) you can now flush a specific cursor out of the library cache using dbms_shared_pool.purge. You need to create the package first, it is not installed by default:-
@?/rdbms/admin/dbmspool
Package created.
Grant succeeded.
View created.
Package body created.
You also need to set an event to allow the purge to work. See metalink note 751876.1:
“The fix has gone into 10.2.0.4. However, the fix is event protected. You need to set the event 5614566, to make use of purge. Unless the event is set, purge will have no effect.”
alter session set events ‘5614566 trace name context forever’;
Now that you have the feature installed you can find the address and hash_value of a cursor you want to purge with eg:
select address, hash_value from v$sqlarea
where sql_text = ‘select count(c2) from skew where c1 = :bind’;
ADDRESS HASH_VALUE
——– ———-
27308318 2934790721
And purge it.
exec sys.dbms_shared_pool.purge(‘&address, &hash_value’,’c’)
PL/SQL procedure successfully completed.
For more comprehensive details check out
Why would you want to flush a specific cursor out of the library cache? Because it is performing poorly and you want the CBO to have another go at coming up with a plan. Before this nice sys.dbms_shared_pool.purge function you had three other options to flush the cursor out.
  • You can flush the whole shared pool
    alter system flush shared_pool;
    You really want to avoid doing this on a live system, as it flushes all SQL, PL/SQL (functions, packages, procedures} and data dictionary information, which will now have to be read back in when next required. It’s like unloading a whole delivery truck just to throw out one letter and then reloading the truck.
  • Alter one of the objects referenced by the SQL statement, with some DDL. Some suggest doing a grant or revoke on a table, I used to try adding a table comment {to what it already was}. I’m still not that comfortable with that option on a live system as you are doing something to a live object.
  • Another option is to gather new stats on one of the objects referenced by the cursor, which is fine so long as there is a small object you can quickly execute a dbms_stats.gather_xxxx_statistics on.
So I’ll look more into this package as I think it is cleaner way to do it. Mind you, there is that setting of an event on a live system…
How does a statement get a poor plan that is going to be fixed simply by asking the CBO to parse it again?
In Harald’s posting he also covers a main reason as to why you would want to flush a sql cursor out of the shared pool. His worked example shows how a SQL statement with a bind variable is open to getting an execution plan the first time it is parsed which is suitable for that first value of the bind – but NOT suitable for most other executions. eg the first value passed to the bind is maybe a very common one matching a large percentage of the table and so an index is not used, but most executions of the statement are with a bind value that matches very few records, and thus the index lookup is the best plan. But once the sql statement is parsed, the plan will be used until the statement disappears out of the  shared pool.
Another cause of a poor plan is when the statistics for an object referenced by the SQL statement changes. The CBO sometimes just chooses a plan that is not good. You may be thinking that, in this case, the optimizer will simply come to the same plan if asked again. Maybe not.
An issue I kept encountering at one site was very interesting. One of a small handful of simple SQL statements would go rouge overnight. Usually about 2 or 3am in the morning. Instead of a plan using a a highly specific index and a couple of table joins, a very, very poor plan was used instead. It only ever occurred early in the morning and only when the automated statistics gathering job had gathered stats on one of the tables involved. It took a while to spot this as the SQL would usually go rogue a while after the stats on the relevant tables had been gathered. This is because SQL statements are not invalidated when the underlying segments have their stats re-gathered by the automated job, they are invalidated “a little later”. It seems on Oracle 10.2 to be within an hour of the gather but not always. {To be totally accurate, this delayed invalidation is due to the DBMS_STATS parameter “no invalidate” defaulting to the value DBMS_STATS.AUTO_INVALIDATE but it can be overridden if you wish}
What seemed to be happening, though I never 100% proved it {so I am guessing, do not take this as a fact} is that one table would have new stats and the range of values for a column would include recent data {let’s say values 1 to 10,000,000}. Another table had the old information and so the range of known values was different {1 to 9,200,000}. This discrepancy would cause the wrong plan to be chosen. {I have a wilder theory which is that the indexes for a table had a different range of values for a column as the table stats had, but there are problems with my theory}.
By the time I logged in to the system in the morning to fix the overnight performance problem, stats on all relevant tables had finished being gathered and prompting the code to re-parse was the solution.
That leads me to the last point {sorry, a very long and wordy post again}.
Sometimes you can’t purge the cursor. The execution plan is stuck. Why?
Let’s say you have a cursor that is executed say 100 times a minute. Normally each execution runs in less than 50 milliseconds. All is fine. It has now gone rogue and it is taking 5 seconds to run, as the execution plan is poor. Each execution completes but at any time there is always at least one session running the code, usually several.
A SQL cursor will not be flushed from the shared pool if it is in use. Thus this rogue cursor gets stuck in the SGA. You can’t alter any of the objects as you can never get an exclusive lock on them. You flush the shared pool in desperation {even on your live system} and the cursor stays there, as even alter system flush shared_pool will not flush out an in-flight cursor. You could try locking the table, but like the DML, you are likely never to get that lock.
In this situation you have to identify the application running the code, stop it and wait for all executions to finish. Not maybe an issue in my example of 5 seconds to complete, but I’ve had the same problem with code run every few minutes now taking over an hour, so we could not wait an hour for it to sort out. In that situation we also had to kill sessions.
Of course, stopping and starting the database will cure the problem but the business may not be too happy about the whole database being shut down. {This prompts a thought – I’ve never noticed this but I wonder if you get the same problem on RAC but only impacting one node?}
This new package may help with stuck execution plans in that you can just keep trying over and over again to flush the one cursor until you hit a moment when no current execution is running.


================


Troubleshooting performance problems is an art by itself, especially when the problem is transient and only shows up once in a while. A classic example of such a problem is an unlucky peeked bind variable causing a sub-optimal execution plan based on the first execution of a SQL statement containing a bind variable on a skewed column. The problem is twofold: first to find such a statement and second to make the problem to go away. The latter is what this posting is all about. In order to demonstrate the problem and the fix we need to have something to play around with.
SQL> create table skew(c1 number(6), c2 char(20));

Table created.

SQL> insert into skew select 1,1 from dual connect by level <= 10000;

10000 rows created.

SQL> update skew set c1 = 2 where rownum <= 10;

10 rows updated.

SQL> create index skew_idx on skew(c1);

Index created.

SQL> exec dbms_stats.gather_table_stats(null,'skew', -
> method_opt => 'for all columns size 2')

PL/SQL procedure successfully completed.

SQL> select c1, count(*) from skew group by c1;

        C1   COUNT(*)
---------- ----------
         1       9990
         2         10
We now have an indexed table with skewed data in it with current object statistics in place including a histogram on the skewed column. Lets execute a query using a bind variable on the skewed column and see what the query optimizer expects and what execution plan it considers optimal.
SQL> var x number
SQL> exec :x := 1;

PL/SQL procedure successfully completed.

SQL> select count(c2) from skew where c1 = :x;

 COUNT(C2)
----------
      9990

SQL> select *
  2  from table(dbms_xplan.display_cursor(null,null,'basic rows'));

PLAN_TABLE_OUTPUT
--------------------------------------------------------------------------------
EXPLAINED SQL STATEMENT:
------------------------
select count(c2) from skew where c1 = :x

Plan hash value: 568322376

-------------------------------------------
| Id  | Operation          | Name | Rows  |
-------------------------------------------
|   0 | SELECT STATEMENT   |      |       |
|   1 |  SORT AGGREGATE    |      |     1 |
|   2 |   TABLE ACCESS FULL| SKEW |  9990 |
-------------------------------------------
The example above shows that the query optimizer predicted the cardinality correctly and choosed the optimal execution plan based upon this information. It could do so because there is a histogram available to describe the data skew in the table. Now see what happens if we bind the value 2 and execute the query again:
SQL> exec :x := 2;

PL/SQL procedure successfully completed.

SQL> select count(c2) from skew where c1 = :x;

 COUNT(C2)
----------
        10

SQL> select *
  2  from table(dbms_xplan.display_cursor(null,null,'basic rows'));

PLAN_TABLE_OUTPUT
--------------------------------------------------------------------------------
EXPLAINED SQL STATEMENT:
------------------------
select count(c2) from skew where c1 = :x

Plan hash value: 568322376

-------------------------------------------
| Id  | Operation          | Name | Rows  |
-------------------------------------------
|   0 | SELECT STATEMENT   |      |       |
|   1 |  SORT AGGREGATE    |      |     1 |
|   2 |   TABLE ACCESS FULL| SKEW |  9990 |
-------------------------------------------
Because the statement is not hard parsed again the same execution plan is used based on the prediction of 9990 rows. Because the query only returns 10 rows this execution plan is no longer optimal for the given value for the bind variable. If this query gets executed many times with this value of the bind variable we do have a performance problem for as long as this execution plan remains in the library cache. If this is indeed the case it might be beneficial to flush this cursor out of the shared pool. Starting with 10.2.0.4.0 this can be done using the PURGE procedure in the DBMS_SHARED_POOL package as demonstrated below:
SQL> @?/rdbms/admin/dbmspool

Package created.

Grant succeeded.

View created.

Package body created.

SQL> select address, hash_value from v$sqlarea
  2  where sql_text = 'select count(c2) from skew where c1 = :x';

ADDRESS  HASH_VALUE
-------- ----------
27308318 2934790721

SQL> exec sys.dbms_shared_pool.purge('&addressash_value','c')

PL/SQL procedure successfully completed.
Because the DBMS_SHARED_POOL package is not installed at database creation time, it has to be installed manually as shown above. The PURGE procedure needs the ADDRESS and HASH_VALUE of the cursor being flushed and the flag ‘C’ to indicate that we are flushing a cursor. This knowledge comes out of the dbmspool.sql script. The ADDRESS and HASH_VALUE can be retrieved from V$SQLAREA as shown in the example. A successful execution of the PURGE procedure indicates that the parent cursor is gone among with its children. A next execution of the query will force a hard parse and the creation of a new execution plan as we can see below:
SQL> select count(c2) from skew where c1 = :x;

 COUNT(C2)
----------
        10

SQL> select *
  2  from table(dbms_xplan.display_cursor(null,null,'basic rows'));

PLAN_TABLE_OUTPUT
--------------------------------------------------------------------------------
EXPLAINED SQL STATEMENT:
------------------------
select count(c2) from skew where c1 = :x

Plan hash value: 3493361220

---------------------------------------------------------
| Id  | Operation                    | Name     | Rows  |
---------------------------------------------------------
|   0 | SELECT STATEMENT             |          |       |
|   1 |  SORT AGGREGATE              |          |     1 |
|   2 |   TABLE ACCESS BY INDEX ROWID| SKEW     |    10 |
|   3 |    INDEX RANGE SCAN          | SKEW_IDX |    10 |
---------------------------------------------------------
This time the query optimizer predicted the correct number of rows for the given value of the bind variable and selected the optimal execution plan for the given situation. The difficulty is of course to detect these situations before we can correct them. An indication could be a difference in the predicted number of rows and the actual number of rows in an execution plan, but therefore we need to set the STATISTICS_LEVEL parameter to ALL or add the GATHER_PLAN_STATISTICS hint to all possible affected statements which might be difficult to do. Once a possible affected statement has been found we can see the used bind value in the execution plan by using the PEEKED_BINDS options in the format specifier in the call to DBMS_XPLAN.
SQL> exec :x := 1;

PL/SQL procedure successfully completed.

SQL> select count(c2) from skew where c1 = :x;

 COUNT(C2)
----------
      9990

SQL> select *
  2  from table(dbms_xplan.display_cursor(null,null,'basic rows peeked_binds'));

PLAN_TABLE_OUTPUT
--------------------------------------------------------------------------------
EXPLAINED SQL STATEMENT:
------------------------
select count(c2) from skew where c1 = :x

Plan hash value: 3493361220

---------------------------------------------------------
| Id  | Operation                    | Name     | Rows  |
---------------------------------------------------------
|   0 | SELECT STATEMENT             |          |       |
|   1 |  SORT AGGREGATE              |          |     1 |
|   2 |   TABLE ACCESS BY INDEX ROWID| SKEW     |    10 |
|   3 |    INDEX RANGE SCAN          | SKEW_IDX |    10 |
---------------------------------------------------------

Peeked Binds (identified by position):
--------------------------------------

   1 - :X (NUMBER): 2
In this final example we bounded the value 1 again and executed the query which retrieved 9990 rows whilst the execution plan shows a prediction of only 10 rows. By using PEEKED_BINDS we receive extra information from DBMS_XPLAN telling us that this particular execution plan is based on the value 2 of the first bind variable in the statement which is named ‘:x’ and is a number data type.
Conclusion: By using the PURGE procedure in the DBMS_SHARED_POOL package we can flush a cursor out of the Library Cache when the execution plan causes performance problems due to an unlucky bind variable value. However this is only a temporary solution. The definitive solution is Adaptive Cursor Sharing which is introduced in Oracle11g.

========================================

Purging Cursors From the Library Cache Using Full_hash_value

Introduction: Purging cursors from the library cache is a useful technique to keep handy for troubleshooting. Oracle has introduced a procedure call to do that in version 11 with backports to 10g. Besides  this has been covered by several blogs already (including , Oracle support (note 457309.1 for example) and the actual package file in $ORACLE_HOME/rdbms/admin/dbmspool.sql

Most of the examples and discussions in the links above utilize with the following syntax:

SQL> exec sys.dbms_shared_pool.purge(‘&address, &hash_value’,'c’)

What's new in 11.2:

A new (overloaded) procedure in dbms_shared_pool.purge is available in 11.2 and allows to purge statements identified by thier full_hash_value of the statement. One of the advantages compared to the previous method is that the full_hash_value is a property of a given sql statement and does not depend on the memory address of the (parent) cursor. Note this has been tested in 11.2.0.3 64 bit for Linux.


Example:

myapp_user_SQL> select /*MYTEST*/ sysdate from dual; -- put test SQL statement that we want to flush in the following
admin_user_SQL> select a.FULL_HASH_VALUE from V$DB_OBJECT_CACHE a where name='select /*MYTEST*/ sysdate from dual';  
-- find full_hash_value to be used in the next step
-- in this example the full_hash_value is 98d0f8fcbddf4095175e36592011cc2c
admin_user_SQL> exec sys.dbms_shared_pool.purge(HASH=>'98d0f8fcbddf4095175e36592011cc2c',namespace=>0,heaps=>1) 

Additional info:

full_hash_value is a 128-bit MD5 hash of the sql statement
A few methods to find full_hash_value given different input are listed here below:
  • find full_hash_value from cache, query v$db_object_cache 
    • select a.FULL_HASH_VALUE from V$DB_OBJECT_CACHE a where name='select /*MYTEST*/ sysdate from dual';
  • find full_hash_value from hash_value
    • select full_hash_value from  v$db_object_cache where hash_value=538037292
  • find full_hash_value from sql_id
    • find hash_value from sql_id using DBMS_UTILITY.SQLID_TO_SQLHASH
    • select  full_hash_value from  v$db_object_cache where hash_value= DBMS_UTILITY.SQLID_TO_SQLHASH('1frjqb4h13m1c');
  • compute full_hash_value from SQL tex
namespace=>0 means 'SQL  AREA' , which is the relevant namespace for cursors.

Conclusions:

We have discussed a method to purge cursors for the library cache that uses the full_hash_value of the cursor instead of the address and hash_value which is the more common approach (and the only one documented in previous versions). This method discussed here is available in 11.2.

Thanks
Srini

Tuesday, 20 September 2016

Data block corruption in particular datafile


Find the Data block corruption details:
SELECT name FROM v$datafile WHERE file#=34;

SELECT ts# "TSN" FROM v$datafile WHERE file#=34;

SELECT tablespace_name FROM dba_data_files WHERE file_id=34--APPS_TS_TX_DATA

SELECT block_size FROM dba_tablespaces 
WHERE tablespace_name = 
(SELECT tablespace_name FROM dba_data_files WHERE file_id=&AFN);---8192

SELECT tablespace_name, file_id "AFN", relative_fno "RFN" FROM dba_data_files;


SELECT *
FROM dba_extents
WHERE file_id = &AFN
and &BL between block_id AND block_id + blocks - 1;

SELECT * 
FROM dba_free_space 
WHERE file_id = 34 
and 682478 between block_id AND block_id + blocks - 1; 

Solution:


RMAN> run {blockrecover datafile 34 block 682478;}
RMAN>  backup check logical validate datafile 34;
analyze table PA.PA_COST_XXX_ALL validate structure online; 

If table has analyzed your in good shape.
If it is not analyzed and it shows again datafile has been corrupted.

 SQL> alter table PA.PA_COST_XXXX_LINES_ALL move;  
Table altered.  


  SELECT * FROM dba_free_space WHERE file_id = 34 and 682478 between block_id AND block_id + blocks - 1; 

Return any rows it means block has been changed.rebuild the indexes on this table.


select * from V$DATABASE_BLOCK_CORRUPTION;
no rows selected.

Now there is no db blocks on Database.

Note: 28814.1 - Handling Oracle Block Corruptions in Oracle7/8/8i/9i/10g/11g

Note: 403747.1 - FAQ: Physical Corruption
Note: 68117.1 - Introduction to the Corruption Category

Note: 840978.1 - Physical and Logical Block Corruptions. All you wanted to know about it
 
Thanks 
Srini

Undo table space using more and 100% Full


Undo table space is not release the data and using more space.
When the UNDO tablespace is created with NO AUTOEXTEND, following the allocation algorithm, here is the explanation for this correct behavior:
For a fixed size UNDO tablespace (NO AUTOEXTEND), starting with 10.2, we provide max retention given the fixed undo space, which is set to a value based on the UNDO tablespace size.
This means that even if the undo_retention is set to a number of seconds (900 default), the fixed UNDO tablespace supports a bigger undo_retention time interval (e.g: 36 hours), based on the tablespace size, thing that makes the undo extents to be UNEXPIRED. But this doesn't indicate that there are no available undo extents when a transaction will be run in the database, as the UNEXPIRED undo segments will be reused.
concerning an UNDO tablespace created with AUTOEXTEND OFF in 10gR2, so there is not need to add more space to it or be concerned by the fact that it appears to be 100% full.
Whether the undo is automatically managed by the database by checking the following instance parameter:
UNDO_MANAGEMENT=AUTO


  1. Whether the undo tablespace is fixed in size:
     SELECT autoextensible
         FROM dba_data_files
         WHERE tablespace_name=''

    This returns "NO" for all the undo tablespace datafiles.
  2. The undo tablespace is already sized such that it always has more than enough space to store all the undo generated within the undo_retention time, and the in-use undo space never exceeds the undo tablespace warning alert threshold (see below for the query to show the thresholds).
  3. The tablespace threshold alerts recommend that the DBA add more space to the undo tablespace:
     SELECT creation_time, metric_value, message_type, reason, suggested_action
         FROM dba_outstanding_alerts
         WHERE object_name='';

    This returns a suggested action of: "Add space to the tablespace".

    Or,

    This recommendation has been reported in the past but the condition has now cleared:
    SQL> SELECT creation_time, metric_value, message_type, reason, suggested_action, resolution
         FROM dba_alert_history
         WHERE object_name='';
  4. The undo tablespace in-use space exceeded the warning alert threshold at some point in time. To see the warning alert percentage threshold, issue:
     SELECT object_type, object_name, warning_value, critical_value
    FROM dba_thresholds
    WHERE object_type='TABLESPACE';

    To see the (current) undo tablespace percent of space in use:
     SELECT
             ((SELECT (NVL(SUM(bytes),0))
               FROM dba_undo_extents
               WHERE tablespace_name=''
               AND status IN ('ACTIVE','UNEXPIRED')) * 100)/       
             (SELECT SUM(bytes)
              FROM dba_data_files
              WHERE tablespace_name='')
             "PCT_INUSE"
         FROM dual
  5. SOLUTION:
    1. Set the AUTOEXTEND and MAXSIZE attributes of each datafile of the undo tablespace in such a way that they are autoextensible and the MAXSIZE is equal to the current size (so the undo tablespace now has the AUTOEXTEND attribute but does not autoextend):
       ALTER DATABASE DATAFILE '' AUTOEXTEND ON MAXSIZE

      With this setting, V$UNDOSTAT.TUNED_UNDORETENTION is not calculated based on a percentage of the undo tablespace size. Instead it is set to the maximum of (MAXQUERYLEN secs + 300) and UNDO_RETENTION.
    2. Set the following instance parameter:
      _smu_debug_mode=33554432

      With this setting, V$UNDOSTAT.TUNED_UNDORETENTION is not calculated based on a percentage of the fixed size undo tablespace. Instead it is set to the maximum of (MAXQUERYLEN secs + 300) and UNDO_RETENTION.
    3. Set the following instance parameter:
      _undo_autotune = false

      With this setting, V$UNDOSTAT (and therefore V$UNDOSTAT.TUNED_UNDORETENTION) is not maintained and the undo retention used is based on the UNDO_RETENTION instance parameter.

      NOTE: This means you loose all advantages in having automatic undo management and is not an ideal long term fix.
    Automatic Tuning of Undo_retention Causes Space Problems (Doc ID 420525.1).


Thanks 
Srini